
The connection pool has been exhausted
See original GitHub issueNpgsql version: 3.2.4 PostgreSQL version: 9.5 .Net version: 4.6.1 Operating system: Win7 x64
We are working on converting an application from RavenDB to Marten which uses Npgsql under the covers. While importing files we are running into the “The connection pool has been exhausted” exception even though I’ve never seen the connections in pgAdmin go over 25-30. I’m running this application on my local box with a local instance of Postgres.
Here is what pgAdmin shows right before the exception occurs:
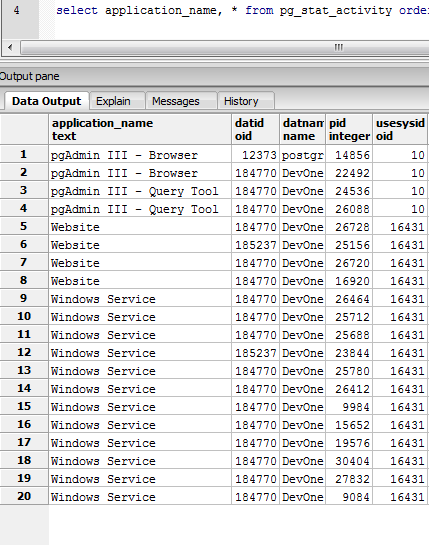 The ‘Windows Service’ is what is doing all of the heavy lifting. The ‘Website’ is just the front end that pushes messages over to the service for processing and does reads for display purposes. It takes a few minutes for this exception to surface and the
 ConnectorPool.Busy property is increasing the entire time until it happens. So there isn’t a sudden burst of activity that makes it exceed the pool size.
After the exception occurs I took a memory dump of the process and dumped the ConnectorPool object and it still shows 98 busy connections. You can also see that there are only 4 NpgsqlConnection and NpgsqlConnector classes in memory.
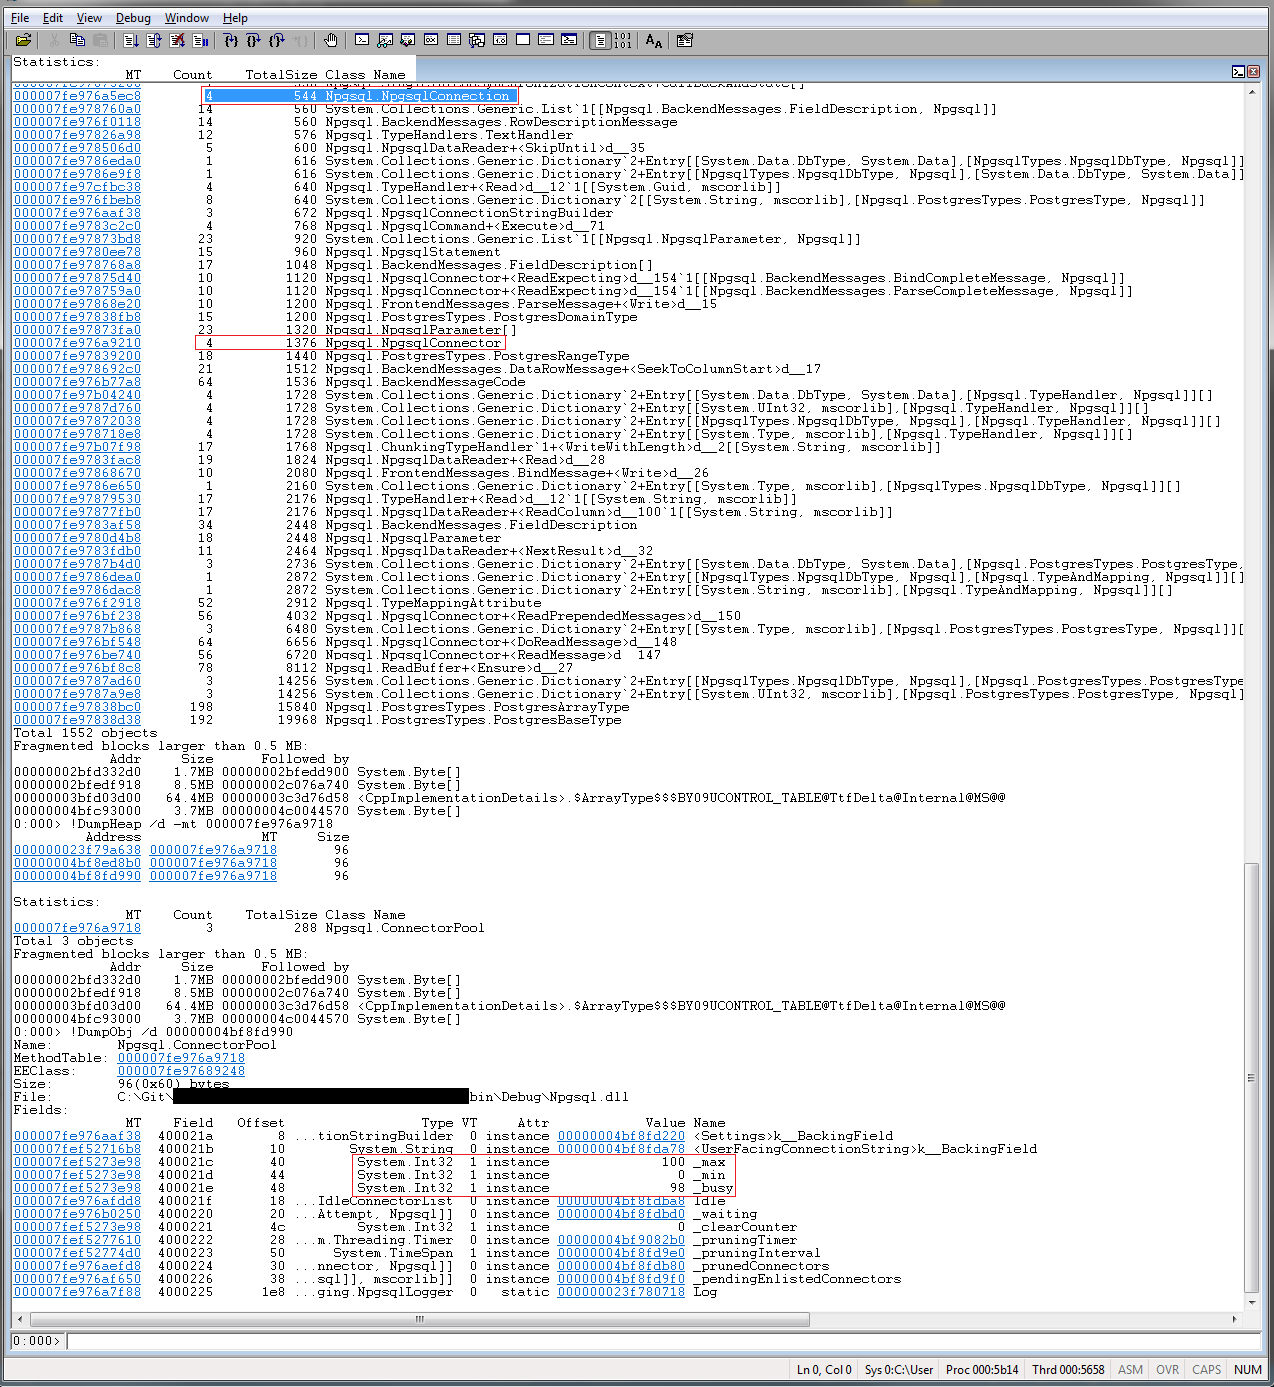
At this point the service needs to be restarted as doing about anything results in subsequent “The connection pool has been exhausted” exceptions being thrown since the pool only has 2 free slots. Calling something like NpgsqlConnection.ClearAllPools doesn’t reset Busy so there isn’t really a way to recover from this that I can see.
One thing I noticed when browsing the ConnectorPool code is that calls to IncrementBusy and DecrementBusy are usually protected with a lock/monitor but not always(here).
Any thoughts? Even if we are leaking connections(which I haven’t seen/verified yet) it doesn’t look like Npgsql is recovering from this exception gracefully. I’m still digging into this issue on my end.
Issue Analytics
- State:

- Created 6 years ago
- Reactions:2
- Comments:13 (7 by maintainers)
 Top Related StackOverflow Question
 Troubleshoot Live Code
 Top Related Reddit Thread
 Top Related Hackernoon Post
 Top Related Tweet
 Top Related Dev.to Post
 Top Related Hashnode Post
After digging into this a bit more it looks like the underlying cause is we have open connections that are getting garbage collected without being disposed(this was buried under lots of abstractions/DI). Rebuilding the npgsql code with a couple finalizers that clean up proved this was what was actually going on. That explains why the server wasn’t seeing the connections and why the objects didn’t show up in the memory dumps. Since they were never disposed the pool didn’t get notified to decrement the busy count.
On a side note the NumberOfNonPooledConnections performance counter would jump from zero to approximately 2,147,483,647 (Int.MaxValue).
@roji I’m seeing a similar issue. I’m not getting an exception, but my busy pool fills up and no connections are released back into the pool. I’m running in a single-threaded async environment (.NET Orleans). What I see is my application very quickly uses the 50 available connections (as expected), but they all remain “busy” despite being disposed (I checked their internal _disposed value to verify.) These are trivial read ops, by the way - not long running SQL ops. So effectively what happens is, my Orleans app launches as many grains as it can when it starts up, but after the 50 connections get used up, the rest of the grains end up waiting indefinitely for the connections to be released. (I have
Timeout=0). I would expect the connections to be released back into the connection pool once they have been disposed but this doesn’t appear to be the case. I’m happy to provide code if necessary.